


- Eden Space (heap): The pool from which memory is initially allocated for most objects.
- Survivor Space (heap): The pool containing objects that have survived the garbage collection of the Eden space.
- Tenured Generation (heap): The pool containing objects that have existed for some time in the survivor space.
- Permanent Generation (non-heap): The pool containing all the reflective data of the virtual machine itself, such as class and method objects. With Java VMs that use class data sharing, this generation is divided into read-only and read-write areas.
- Code Cache (non-heap): The HotSpot Java VM also includes a code cache, containing memory that is used for compilation and storage of native code.
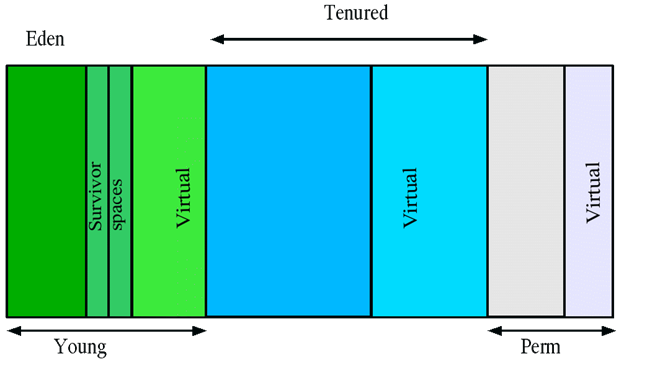
The
heap itself is separated into three areas: Tenured
(also called Old), Young (also
called New), and Permanent (Perm).
The idea behind this is to make garbage collection more efficient. Permanent should never require collection (although you can configure it), Old should be rarely collected, and Young will be collected a lot.
The idea behind this is to make garbage collection more efficient. Permanent should never require collection (although you can configure it), Old should be rarely collected, and Young will be collected a lot.
The Young area usually shows a lot of activity, so most garbage collection
algorithms are designed to optimize collections in that area. The graph below (taken from Oracle
documentation) shows how the age of objects is typically distributed. While
most objects only live for a short time, there are also quite a few objects
that stay alive a bit longer than 2-3 Young generation garbage collections
(called minor collections). So the Young collection will be performed by saving
the ones that survive in so-called survivor spaces. Objects stay in the
survivor spaces until they have survived long enough to be promoted into the
Old generation. Due to the way GC works, two Survivor Spaces
are used and one of them is always empty. The remaining part of the Young
generation is called Eden.

Heap Metrics:
So how is the total memory distributed onto the different areas? The JVM offers us to keep track of a lot of information on memory via JMX. For example, there is a good command line utility which shows you the usage of all your spaces:
jstat
For my running jvm itself:
Syntax: jstat -gcutil <ProcessID>
But what is the size of those spaces?
jstat
-gc
reveals this:
D:\Surendra>jstat
-gc 0
S0C S1C S0U
S1U EC EU
OC OU
PC PU YGC
YGCT FGC FGCT GCT
64.0 64.0 64.0
0.0 896.0 0.0
7168.0 202.5 12288.0
2500.7 2 0.004
0 0.000 0.004
Lots of numbers, all in kilobytes.
All options and columns are explained below (Source:www.oracle.com)
Column
|
Description
|
S0C
|
Current survivor space 0 capacity
(KB).
|
S1C
|
Current survivor space 1 capacity
(KB).
|
S0U
|
Survivor space 0 utilization (KB).
|
S1U
|
Survivor space 1 utilization (KB).
|
EC
|
Current eden space capacity (KB).
|
EU
|
Eden space utilization (KB).
|
OC
|
Current old space capacity (KB).
|
OU
|
Old space utilization (KB).
|
PC
|
Current permanent space capacity
(KB).
|
PU
|
Permanent space utilization (KB).
|
YGC
|
Number of young generation GC
Events.
|
YGCT
|
Young generation garbage
collection time.
|
FGC
|
Number of full GC events.
|
FGCT
|
Full garbage collection time.
|
GCT
|
Total garbage collection time.
|
Configuring Heap:
What can we configure, now that we know the occupation and sizes of the spaces? While the sizes offer a lot of configuration functionality, they are usually only touched when looking at garbage collection. All heap areas are equally good for storing data, but for garbage collection you might want to change some.
Without configuration, a client JVM uses this calculation for the spaces:
Heap = Tenured + Young
Tenured = 2 x Young
Young = Survivor x 2 + Eden
A common change is increasing the maximum Permanent generation size using -XX:MaxPermSize=128m. The initial size can be set with -XX:PermSize=64m.
Depending on the application, the New size can also be adjusted. This can be done as ratio
-XX:NewRatio=2 (which is recommended, as it adjusts automatically), or as fixed size -XX:NewSize=128m or -Xmn128m (which is less flexible but easier to understand).
All ratios are configured as “one of me – N of the other”, where N is the value provided to the flag. For example, -XX:NewRatio=2 means 33% of the heap are for New and the remaining 66% are for Old.
Young space can be configured by using -XX:SurvivorRatio to control the size of the survivor spaces, but this is often not very effective.
A typical configuration for a web application could look like this:
-Xms2g -Xmx2g -XX:NewRatio=4 -XX:MaxPermSize=512m -XX:SurvivorRatio=6
The total memory used by Java would be slightly over 2.5GB. Old would be 1.6GB, Eden 300MB, and each Survivor Space 50MB.
Monitoring Heap:
Because the JVM is providing a lot of information on the heap,
command line output is not the most convenient way to read it. In the
screencast below, I will show you three tools for looking at the heap:
- JConsole, basic UI to read the JMX metrics provided by the JVM
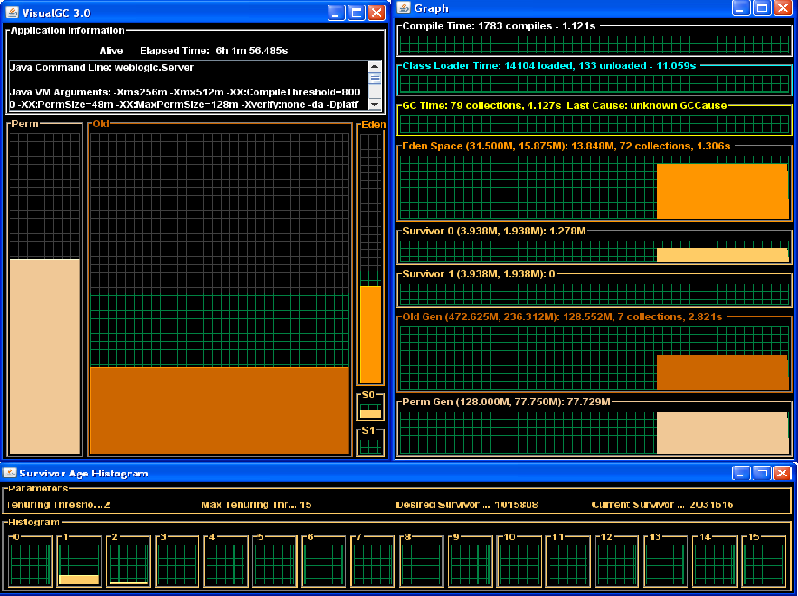
- Visual GC, a great GC visualizer also available as plugin for VisualVM – suited best for on the spot analysis
- AppDynamics, providing long term monitoring for memory statistics
Visualgc looks like below:
visualgc <PID>
Jconsole looks like below
jconsole <PID>

Heap Dumps:
The most accessible tool to approach analyzing memory issues are so called Java heapdumps, which can be created automatically in the event of an OutOfMemoryError by passing the JVM command line parameter -XX:+HeapDumpOnOutOfMemoryError. In this case the JVM will write the dump right before it exits. Analyzing these kind of dumps is also called “Post mortem”, as the JVM is already dead.
Java Heap Dumps:
A heapdump is a textual or binary representation of the Java heap which is usually written to a file.
Heapdumps can contain to kinds of objects:
- Alive objects only (those are objects, which can be reached via a GC root reference)
- All objects (including the no longer referenced, but not yet garbage collected objects)
Because the live objects can be easily determined from various VM internal mechanisms, a heapdump containing only live objects can be created acceptable fast. Creating a full heap dump with dead objects as well takes much longer and also consumes more disk space.
However, the live objects are sufficient to search for Memory Leaks. Unreferenced objects are only of interest in respect to Object Cycling or GC Thrashing. In those cases one wants to find unnecessary or excessive object allocation.
However, the live objects are sufficient to search for Memory Leaks. Unreferenced objects are only of interest in respect to Object Cycling or GC Thrashing. In those cases one wants to find unnecessary or excessive object allocation.
Creating Heap dumps:
As said initially, heap dumps can be created in 2 ways. But the creation of a dump will halt the JVM and all running processes and applications. This is required to be able to dump a consistent state of the memory. Due to this halt, it is not recommended to use this functionality on a production system very often.
As said initially, heap dumps can be created in 2 ways. But the creation of a dump will halt the JVM and all running processes and applications. This is required to be able to dump a consistent state of the memory. Due to this halt, it is not recommended to use this functionality on a production system very often.
jmap -dump:live,format=b,file=<filename> <PID>
The option live is important, as it will restrict the dump to live objects only. If you want to have also dead objects, simply omit this option. Format “b” (for “binary”) is recommended. While there is an ASCII version as well, manually analyzing it is almost impossible due to the amount of data.
There are a few tools for analyzing heapdumps offline. But detailing a comparison here is not worth the effort, as there is a clear winner:Eclipse Memory Analyzer Toolkit (Eclipse MAT) Eclipse MAT can read, parse and analyze dumps of various formats and sizes. It has an easy to use, but sometimes a bit too powerful, user interface and is completely free to use.
While older tools required to load the whole dump into memory, requiring very often 1.5 times the size of the dump as free memory, MAT will index the dump initially which allows fast analysis using just very few system resources. This enables users to work even with very large heapdumps.
While older tools required to load the whole dump into memory, requiring very often 1.5 times the size of the dump as free memory, MAT will index the dump initially which allows fast analysis using just very few system resources. This enables users to work even with very large heapdumps.
After opening a dump with Eclipse MAT following objects are usually listed very often:
- char[]
- java.lang.Object[]
- java.lang.Class
- java.lang.String
- byte[]
- java.util.HashMap
- java.util.HashMap$Entry
- short[]
- int[]
- java.util.ArrayList
- java.lang.Integer

In my point of view it is essential to know the different memory areas of the JVM and its functions if you want to understand why a java.lang.OutOfMemoryError occurred in your application. I hope that I have made clear that there can be many variations of this error with totally different possible causes.
1 comments:
Nice information reg the OOM
Post a Comment